On the 29th of June, the UK Department for
Business, Energy & Industrial Strategy (BEIS) released the country’s
quarterly electricity data, indicating both the capacity for electricity
generation from various sources, and the actual level of generation that has
occurred. These data (and attached statistics) aren’t widely publicised, so
here follows a summary of how bioenergy holds up in the UK’s electricity
generation picture.
We define Bioenergy as an umbrella term for the following
five electricity sources featured in the data: Sewage Sludge Digestion, Landfill
Gas, Animal Biomass, Anaerobic Digestion and Plant Biomass. In terms of both
capacity and generation, biopower generation is heavily dominated by plant
biomass, which, at nearly 3GW of capacity, accounts for over 60% of the UK’s
bioenergy infrastructure, and over 75% of its generation.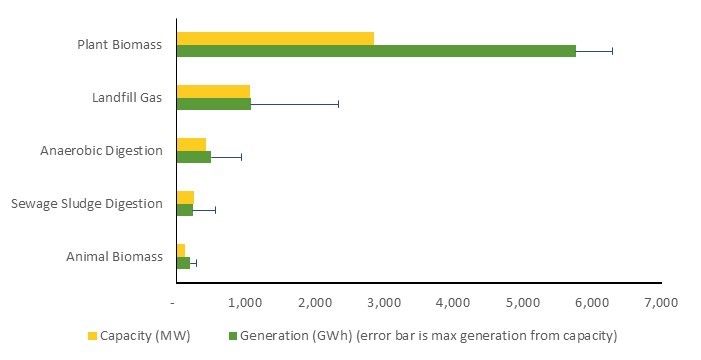
Since last quarter, there has been an increase of nearly 20%
in generation from the bioenergy sector, which is lower than for renewables as
a whole, but since total UK electricity generation remained approximately the
same as last quarter (an uncommon occurrence, as Q1 tends to be the
highest-generation quarter, due to more demand during the darker months), this
is a good sign. Comparing to the same quarter last year, bioenergy capacity has
increased by nearly 5%, a rise driven by Anaerobic Digestion and Plant Biomass,
both of which have seen capacity increases of over 50MW (which is a bigger deal
for AD – this amount equates to a 15% increase in capacity). Despite this, power
generation from AD is down approximately 8.5% on last quarter, with output from
all other bioenergy sources being up by around 20%. Although relative increases
are good to assess a technology’s progress in development, it should be noted
that Plant Biomass’ dominance is still very much evident when looking at the
real increases – generation is up by over 1TWh on last quarter.
Stable Trends
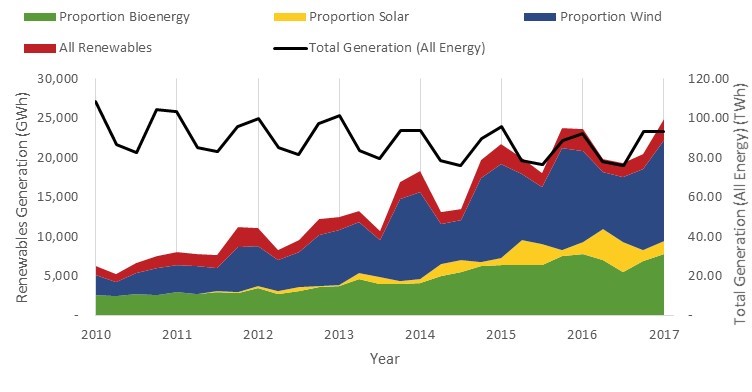
The data also reveal trends in bioenergy since 2010, which
offers long-term insight into where the bioenergy piece fits in the renewables
puzzle. In 2010, bioenergy’s contribution to the UK’s total electricity
generation was 1.5%; in the ensuing 7 years this has risen to 8%. This increase
is in keeping with increases in renewables as a whole, as evidenced by
bioenergy’s share of renewable generation remaining reasonably consistent, at
around 15%.
The makeup of the bioenergy sector also has a noticeable
bearing on how each technology has developed over the time period covered in
the data. Anaerobic Digestion, for example, which is a sector built around many
small-scale plants, has seen consistent levels of growth since 2010, as new
plants pop up all around the country. Compare this with the plant biomass
sector, which is dominated by large scale producers such as Drax, and thus sees
more sporadic increases in capacity, but these are of far greater magnitude
than anything experienced in the other sectors. One example of this is Drax setting
about converting their coal stations to burn wood pellets. In terms of generation,
all of the individual sub-sectors within bioenergy have remained reasonably
consistent in their increases, with the notable exception once again being
Plant Biomass, which, in line with big capacity increases, sees large, stepped increases
in its generation, with no significant relative growth in the meantime.
One thing that sets bioenergy apart from other
renewables such as solar and wind power is the comparative lack of external
factors that influence generation. Bioenergy Load Factors are always higher
than for renewables as a whole, and also do not suffer from the seasonal
fluctuations seen in solar and wind. This indicates that while other renewables
are slated to bring the majority of renewable electricity both at present and
in future, bioenergy can be the solid foundation upon which a renewable
electricity industry can grow and flourish.